πAnalytics
Measure a Dapta Form: pick a date range, read the Views, Starts, Submissions, Completion rate, Time to complete and Partial submits cards, follow the Trends chart and find the question people abandon
Analytics answers two questions about one form: how many people got through it, and where the rest gave up. The header reads Analytics / Funnel performance and question-by-question drop-off.
Step 1: Open the form and click the Analytics tab (or pick the form from Analytics in the left menu). Choose the period you want with the range chips: All time, Today, Last week, Last month, Last year or Custom.

All time
Everything since the form was created. This is the default.
Today
The current day.
Last week
A rolling window of the last 7 days, ending today.
Last month
A rolling window of the last 30 days, ending today.
Last year
A rolling window of the last 365 days, ending today.
Custom
The exact From and To dates you choose.
Step 2: For a specific period, click Custom, pick a From date and a To date in the calendar, then click Apply.

You can leave one side open: a From with no To runs up to now. If you enter the dates the wrong way around, they are swapped for you.
β οΈ Note: Days are counted in UTC, not in your local timezone. That is deliberate: it means you and a colleague in another country read the same number for the same range. A response late in your evening may therefore land in the next UTC day.
Step 3: Read the metric cards. They sit above everything else and summarise the range in one line.

Views
People who opened the form. Counted once per browser session, so a refresh is not a second view.
Starts
People who reached the first question. On a form with a cover screen, the gap between Views and Starts is how many people never clicked past the cover.
Submissions
Responses that reached the end and were submitted.
Completion rate
Submissions divided by Starts, as a percentage. It is blank when nobody started in the range, because there is nothing to divide by.
Time to complete
The median time from opening the form to submitting it, written as seconds, minutes and seconds, or hours and minutes. It is blank when no completed response in the range can be measured.
Partial submits
Responses saved at the Partial submit point that never reached the end. See Partial submissions.
Bookings
People who booked a meeting from a Scheduler step. This card only appears when there is at least one booking, so a form without a scheduler never shows a permanent zero.
Step 4: Follow Trends / Daily movement over the selected range. to see how the form performed day by day. Use the Metric select to switch between Views, Starts, Submissions, Completion rate and Time to complete.

Days with no activity are drawn as zero rather than skipped, so a flat stretch really means a quiet stretch. A range that covers a single day shows a single point. When the range holds no activity at all, the chart is replaced by No activity in this range yet.
Step 5: Scroll to Question-by-question drop-off / How many people reach each step, and how many leave. to find where people stop.

The first row is Form views on a form without a cover screen, or Cover / landing on a form that has one.
Then comes one row per question, in order, with its position marked next to the question text.
Views counts the people who reached that step; the bar makes the shape of the funnel visible at a glance.
Drop-off shows how many people were lost between the previous row and this one, with that loss as a percentage. A row nobody left shows
0.
On a one-page form the middle column is titled Answered instead of Views, and the subtitle changes to How many people answer each question, and how many stop there. Every question is on screen from the start there, so counting views per question would tell you nothing.
The two empty states
The page tells you which kind of empty you are looking at.
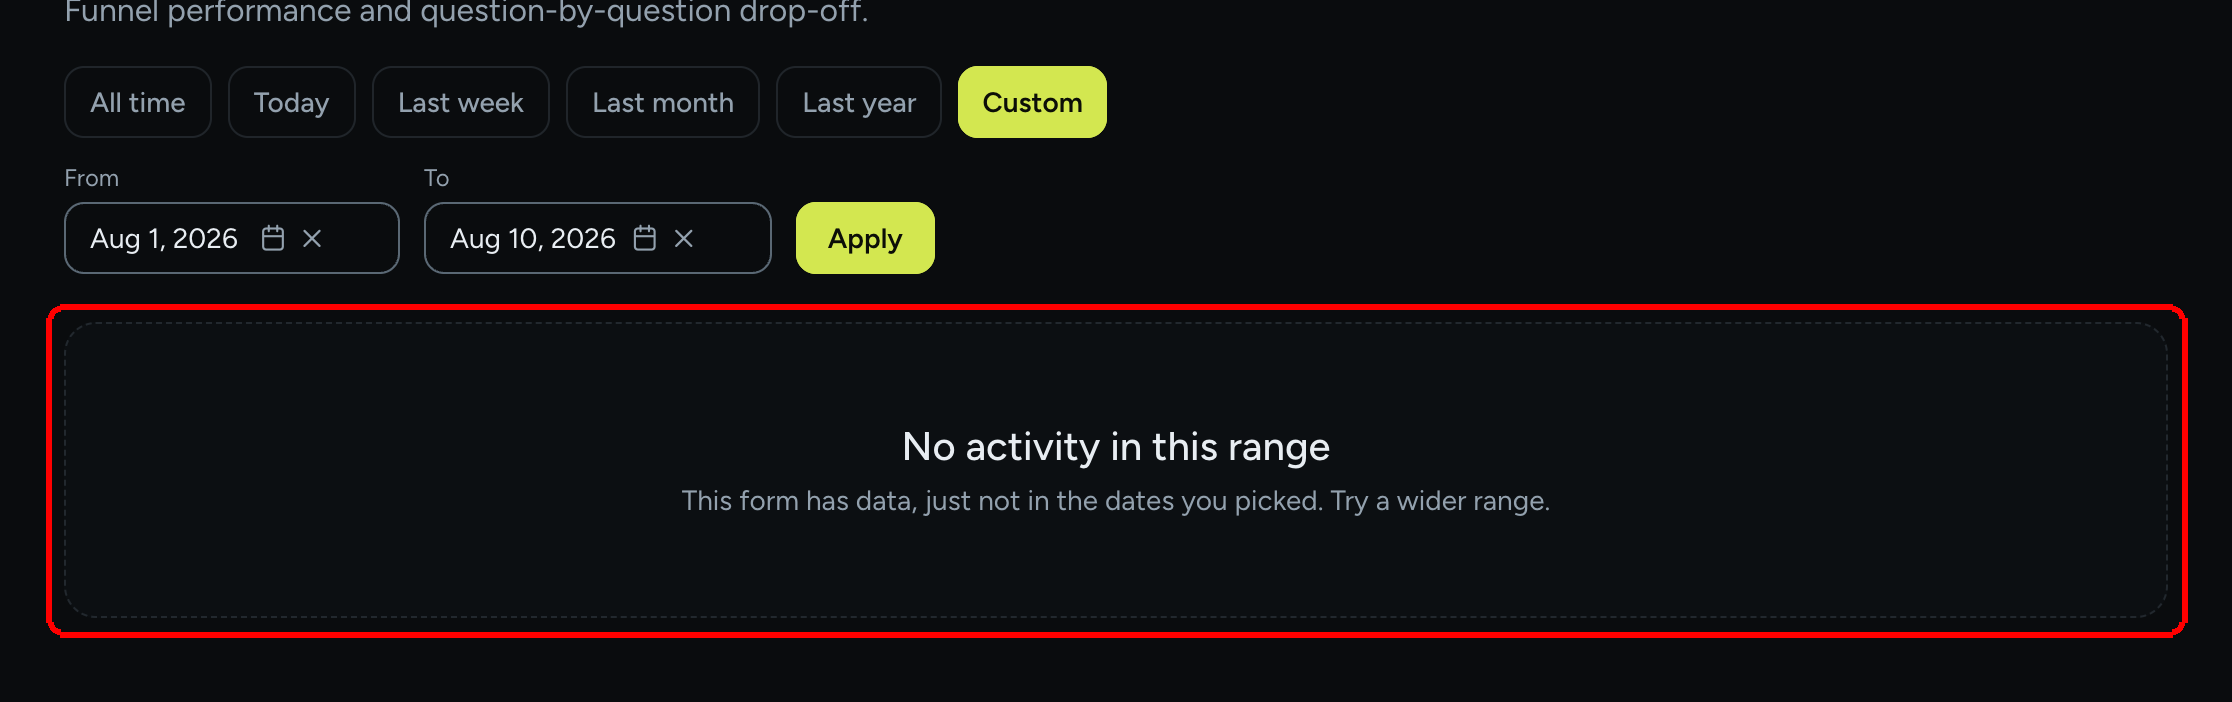
No activity in this range / This form has data, just not in the dates you picked. Try a wider range. The form has responses, just none inside the dates you selected. Widen the range or switch back to All time.

No data yet / Once people open and fill out this form, the funnel and drop-off will appear here. Nobody has opened this form at all. Publish it and share its link.

What Analytics does not show
There is no breakdown by outcome, no average score, and no device, browser or country reporting. Dapta Forms does not record those things about your respondents. To segment by traffic source, add utm_* parameters to the links you share: they are stored with each response and forwarded to HubSpot and your webhooks.
What's next
Submissions: the individual answers behind these numbers.
Export to CSV: take the responses into a spreadsheet.
Partial submissions (lead capture point): capture the leads counted under Partial submits.
Scheduler step & Calendly: the step behind the Bookings card.
Last updated